Single Family Residential Report
Values for single-family homes in Santa Cruz County continue to rise, but the number of active and pendings reached a four-year high last month. The following is a snap shot of recent market statistics covering the single family housing market in Santa Cruz County. The analysis presents a broad-brush overview of market indicators such as median sales price, month’s of inventory, and sales volume.
Median Sales and List Price
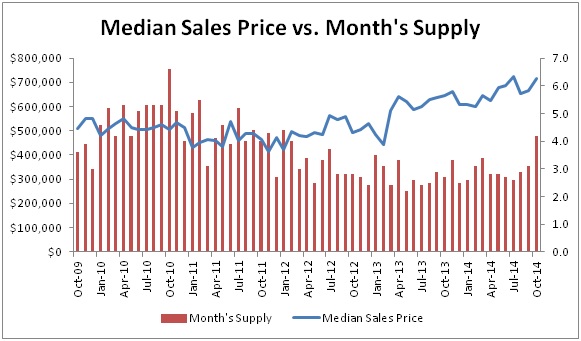
The median selling price of a Santa Cruz County single-family home increased last month on a year-to-year comparison. The median sales price of such a home was $647,000 in October 2013 versus $715,000 in October 2014, a boost of 10.5%. Last month, the median sales price was $665,000.
Source: MLS Listings.com (As of 11/8/14)
Month’s Supply
The inventory of active listings has long been a vital leading indicator of housing market dynamics. Ultimately, the inventory ratio provides the best predictor of near-term market direction and one of the major keys to understanding price shifts in the market.
There was a 4.2 month supply reported in October 2014, which is the first time there’s been over four month’s supply in 2.5 years. While the increase in supply could be a sign of stabilizing values, it is still below the nine-year average of 5.3 months. Even at four months of inventory, the median sales price will likely continue to climb, albeit at a slower pace.
Days-On-Market
Another indicator of market dynamics is the number of days a property is on the market prior to being sold. As demand increases and supply shrinks – the time it takes to sell a property will decrease. For days on market, the median tends to be a better indicator as the average can easily be skewed.
Source: MLS Listings.com (As of 11/8/14)
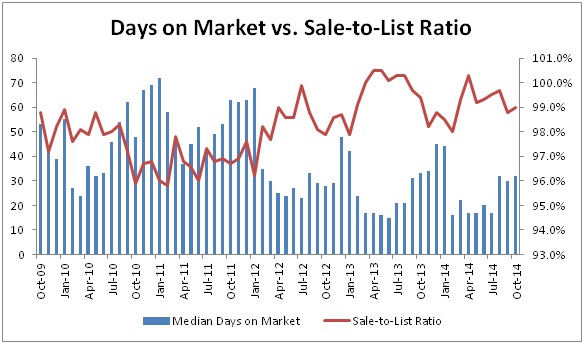
Historically, days-on-market for a home in Santa Cruz County ranged from 15 to 128 days, and averaged 47 days. Currently, the October 2014 median days on market is 32 days, nearly identical to the 33 days reported in for the same time period last year.
Sale-To-List Ratio
Limited supply and pent up demand will tighten the ratio of sale to list price. Historically, sellers have been able to command approximately 98.0% of asking. The October 2014 sale-to-list ratio is 99.0%, which is just slightly under the 99.40% reported in October 2013.
Number of Sales and Number of Active/Pending
The volume of single-family home sales was down slightly. Last month, 167 single-family homes were sold in Santa Cruz County, compared with the 172 sales in October 2013; a decline of about 2.9%. Active and pending homes have seen a more significant jump. In October 2014, there were 698 active/pendings compared to the 467 reported in October 2013. That’s a 49.5% increase, and the highest number of active/pending homes since October 2010.
Source: MLS Listings.com (As of 11/8/14)
If the housing supply continues to increase, values should begin to stabilize. If this supply crosses the six month mark, active listing and pending inventory will be above the nine-year average and we should see prices start to decline. In our research we have noticed that the Santa Cruz housing market typically trails the housing market in the rest of the Bay Area by 9 to 12 months. If we see home values decline in the Bay Area, we can expect this to spill over to Santa Cruz within the year. As of right now, the current market activity supported by historical trends suggests slow but modest price increases in the Santa Cruz single family residential market.
If you have any questions, please feel free to call us anytime at (831) 607-3800.


